Tracking results is important in all marketing, but today let’s look specifically at measuring quality and quantity in lead and business generation.
There are two main questions to consider
- Choosing the most suitable KPI for your situation
- Ensuring your measurement balances high volume low quality results and low volume high quality results
(Of course we all want a high volume of high quality results. Unfortunately this is more likely to happen in marketing sales pitches than in reality!)
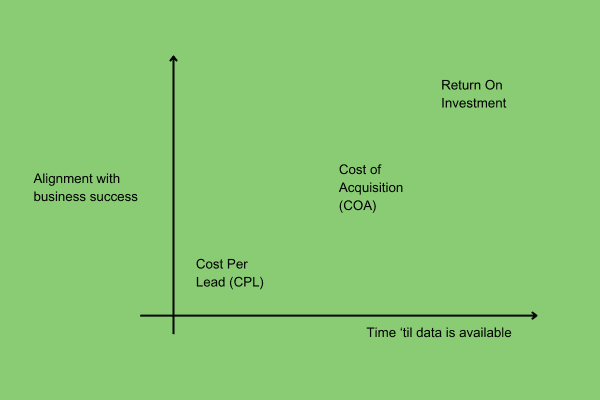
Cost per lead, cost per customer and ROI
There are three accepted ways to measure the success of your marketing. So let’s start by looking at these and why you would or would not use them.
Cost per lead (CPL)
This is the simplest of all. You spend $1000 on Google Ads and you get ten leads. The cost per lead (CPL) is $100.
Advantages of this as a main measurement:
- It’s easy to implement and calculate.
- You usually get results quickly. When you spend money on ads, you tend to know quickly whether they are generating leads.
- It’s an easy way to compare channels to market.
- There are many cases where sales is handled internally, but marketing campaigns may be run by different suppliers. Measuring cost per lead is a great way to compare these suppliers.
But cost per lead has its challenges too:
- It assumes all leads are equal, but in the real world, some leads are more equal than others.
Example
A couple of years ago I ran some Facebook marketing. I got plenty of leads, at a cost per lead of below $10. But I didn’t get a single new client. I actually spent more than $10 per lead of time following up and trying to close business.
On the other hand, I interact fairly regularly, but with no dollar outlay, on LinkedIn. I don’t get huge numbers of leads, but about 1 in 3 of those enquiries turns into business.
For my business, Facebook generates quantity and LinkedIn generates quality.
Cost to acquire a client (cost of acquisition or COA)
Perhaps the above example makes you think it would be better to measure the cost to acquire a client, rather than the cost per lead?
In an ideal world, you’d be correct. A lead which converts to a customer is almost by definition high quality. (Unless of course they’re the customer from hell!)
You’d be correct for some real-world businesses too: ones where clients decide and buy quickly. Maybe you restore hacked websites, or contest traffic fines and penalty points, or you’re a locksmith helping people who’ve lost their keys. Your clients have an urgent need. They buy or don’t buy in a very short time.
However, some businesses have a very long lead-time between first enquiry and closing a customer. (I’ve been talking to one business for two years and they only just committed to a project.) If these businesses use Cost of Acquisition to measure effectiveness, they have to wait for years to get answers. That’s not practical.
Return on investment (ROI)
Return on investment is of course the ultimate measure of effectiveness. How much did you spend to get the client, and how much is the client worth to you?
But how do you calculate the value to you of a repeat or ongoing client? Lifetime value (LTV) goes on increasing until the client leaves you – and how long will that be?
So you can see that while these measures are increasingly accurate (ie high quality), they’re also increasingly difficult to use in any meaningful timeframe.
What’s the learning here?
Pick the most useful measure for your business, but when you’re assessing results, remember it’s not a perfect measure.
Cost per lead is useful because you get results you can act on quickly, but it measures quantity rather than quality.
So how do you measure quality in a practical timescale?
Assessing the quality of leads and customers
What do we mean by ‘quality’? In this case, ‘quality’ means the lead has potential to become a good customer, delivering high lifetime value and ROI.
Example
You run a large printing company, servicing clients across Australia and New Zealand. That includes retailers, hospitality companies and franchises where you print for multiple outlets. You print everything from business cards to brochures, catalogues, direct mail and point of sale. You even offer a service where you print in bulk, store and then distribute on demand.
You get a lead who wants 500 business cards. Is that a quality lead?
Probably not. Sure, this could be an enquiry from a marketing manager who prints weekly or monthly flyers, but the chances are small. This lead could just as easily be a small business owner with a minimal print budget.
What if someone enquires about presentation folders or brochures? This looks more promising. The company has some sales and marketing budget.
What about an enquiry for business cards from a ‘State Manager’? This too has potential. But the State Manager might be the only employee in the state. Or major campaigns could be managed centrally, with your contact having no input into those decisions.
You can see how quality is subjective and hard to measure. In larger businesses, conflict between marketing and sales often arises because marketing measures quantity and sales focuses on quality.
What can you do?
- Recognise that every measure is a quality vs quantity trade-off.
- Start by measuring quantity – it’s easier and quicker. Use cost per lead data for marketing decision making until you have some longer-term data.
- Look for patterns. What percentage of leads convert? How fast? Are they difficult to deal with? How closely do leads match your customer persona?
- Start at the end. Identify your most valuable clients and backtrack to work out where they came from. But do it with enough clients that you’re not swayed by one special case. You need a pattern.
Marketing is messy. You don’t always get all the data you need. And the data you do get doesn’t always tell the whole story. But it does give you hints.
Let’s finish with a real-life example from running rsvp.com.au.
A real life example of tracking quality vs quantity
Once upon a time, I ran the internet dating site rsvp.com.au. When I started there was very little marketing measurement, so I had a pretty clean slate.
Starting with quantity
I started with the data we had – the average spend per member. I used that, along with costs and profit targets, to set a target cost for acquiring a new member. NOTE – acquiring a member didn’t actually guarantee they spent any money with us, so the member is essentially a lead.
We used this to track how different marketing channels were performing. Members acquired from TV had a spectacularly low cost per member. Looked great. We invested more into TV.
Adding measurement of quality
But – there’s always a but! – after a time, we had enough data to look at spend per member for each marketing channel. And guess what? Those members we scored at an amazingly low cost from TV didn’t actually spend that much.
To make it worse, they were mostly men. 70% of member spend came from men, so if a marketing channel generated lots of male members, we’d expect it to have a higher spend per member.
(Aside: the male / female analysis made sense for a dating website. If you ever do a similar exercise, your categories might be different. Suburb. Age. Industry. Company size. Job title. It depends on your business.)
We clearly weren’t getting ‘quality’ members from our TV spend!
On review, it wasn’t entirely surprising.
Most of our TV advertising was late-night, to keep it affordable. Which of these guys is watching TV at 1am? And which is our ideal (male) customer?


Using that ‘quality’ data
We used our ‘average spend per member per channel’ data to set a different target cost per lead for each channel. Then we went back to our suppliers
In other words – if the leads you provide are (on average) lower quality, I want to pay less per lead to make it worth my while!
With data to back up our position, we were in a strong position to negotiate.
Additional thoughts
As I mentioned, marketing is messy. Marketing measurement is especially so. Not only should you consider quality vs quantity, there’s also the thorny question of attribution.
- If you’re using multiple channels to market to the same clients, how do you know which channel converted them? Is it the one which first made them aware of you? Every touchpoint along the way? Or the one which finally triggered them to take action? There’s no one right answer.
- Also, how do you know which channel triggered the action? We asked new members. We also tracked where new members came from online. The two datasets didn’t add up. Lots of members who clicked on an online ad told us they came from TV, friends, radio and other channels.
So what are the learnings?
Marketing is messy. Marketing data is dirty, messy and inaccurate.
But dirty, messy, inaccurate data is better than no data at all. Just use it with caution.
Use the data as a starting point. Use it to ask questions. Use it to understand your clients. Use it to negotiate with suppliers.
And if you need some help, there’s no cost to get in touch and have an initial chat.